Note
Go to the end to download the full example code
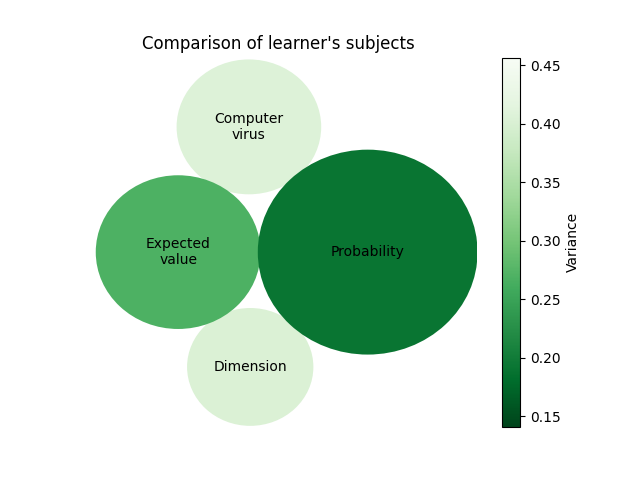
BubblePlotter Example#
This example shows how to use the BubblePlotter class
to generate a bubble chart to compare learner’s interest
across different subjects.
In this example, we use the InterestClassifier to build
a representation of the learner’s interest. You could also use
other classifiers like KnowledgeClassifier or NoveltyClassifier
to build a representation of learner’s knowledge.
from truelearn import learning, datasets
from truelearn.utils import visualisations

data, _, _ = datasets.load_peek_dataset(test_limit=0, verbose=False)

# select a learner from data
_, learning_events = data[12]

# you could disable positive_only mode, which is enabled by default
# for knowledge classifier. After you disable it, the knowledge classifier
# will update the knowledge event if the label is False
classifier = learning.InterestClassifier()
for event, label in learning_events:
    classifier.fit(event, label)

plotter = visualisations.BubblePlotter()

# you can select topics you care about
plotter.plot(
    classifier.get_learner_model().knowledge,
    topics=[
        "Expected value",
        "Probability",
        "Dimension",
        "Computer virus",
    ],
)

plotter.show()
Total running time of the script: (0 minutes 9.258 seconds)